
Abstract
Aim
This study aims to provide preliminary reference balance values for young adults and examine factors influencing balance, addressing the lack of research in this age group, using the Zebris FDM-S pressure platform.
Methods
A cross-sectional observational study was conducted with 28 healthy adults aged 18 to 30 years. Balance-related measurements and weight distribution were assessed in bipodal and single-leg stances with eyes open and closed. Preliminary reference values were obtained through descriptive analysis, and comparisons were performed using non-parametric statistical tests, considering sex, dominance, and knee alignment.
Results
Women demonstrated greater control during single-leg balance, lower-limb dominance does not affect balance performance during single-leg stance, whether with eyes open or closed. A non-neutral knee alignment (varus or valgus) appears to alter anterior–posterior weight distribution during bipodal stance with eyes closed. Knee alignment, whether varus or valgus, influenced the anterior-posterior weight distribution during bipodal stance. The preliminary reference data obtained may serve as an initial benchmark for injury prevention and post-injury evaluation, diagnosis. However, these findings should be interpreted with caution until they are confirmed in larger samples.
Conclusions
Women demonstrate greater stability during single-leg stance with eyes open. Lower-limb dominance does not appear to affect balance performance in single-leg stance. Varus and valgus alignment seem to alter anterior–posterior weight distribution during bipodal stance with eyes closed.
1. Introduction
Balance is a motor function that plays a crucial role from the beginning of life to its end. It refers to the ability to maintain the centre of mass within the base of support provided by the feet. The vertical projection of the centre of mass onto the ground is known as the centre of gravity (CG) (Patti et al., 2018).
Static balance is defined as the ability to maintain a stable base of support with minimal movement of the CG, whereas dynamic balance refers to maintaining stability while performing a task (Kamieniarz et al., 2018; Ricotti, 2011).
Balance relies on sensory input from the vestibular, visual, and proprioceptive systems, which deliver afferent and efferent information to the muscular chains (Patti et al., 2018). It results from a complex interaction between sensory and motor components (Mierau et al., 2017). The spinal cord, brainstem, cerebellum, and cerebral cortex all contribute to postural and balance control (Mierau et al., 2017). Additionally, balance is strongly influenced by optimal joint range of motion (ROM) and muscular strength (Ricotti, 2011).
It is a fundamental ability for performing daily activities and athletic tasks (Shin et al., 2020). Joint and ligament injuries of the knee and ankle, currently among the most common in athletes, are often linked to strength deficits or disturbances in stability and balance (Ricotti, 2011).
Balance training induces neural adaptations at both spinal and supraspinal levels. This process suppresses spinal reflex excitability, reducing destabilising movements and improving balance performance. Additionally, balance training has been shown to increase the rate of force development (RFD), thereby improving muscle power and enhancing performance in specific motor skills such as vertical jumping (Hrysomallis, 2011).
Regular assessment and monitoring of both static and dynamic balance in athletes can serve as a valuable tool for designing and adjusting training programs. These evaluations should consider the type of sport, balance scores, and the athlete's age (Ricotti, 2011).
Various balance control strategies exist, but regardless of the specific strategy employed, it is essential to quantify and measure balance as objectively as possible (Ricotti, 2011). Any disruption in balance is a common indicator of a wide range of neurological, vestibular, or musculoskeletal conditions. Therefore, precise, objective, and reliable assessment tools are needed. Early detection of balance impairments and timely intervention can help prevent dysfunction and preserve an individual's independence (Domènech-Vadillo et al., 2019).
Currently, stabilometric platforms are the most widely used method for evaluating both static and dynamic balance. Analysing foot pressure allows for a better understanding of its interaction with the contact surface (Richter, 2020). These platforms are equipped with pressure sensors arranged parallel to the support surface.
Several studies have reported reference values for balance and postural stability across different populations. Recent studies have also emphasised the need for population-specific reference data and objective posturographic measures to enhance the interpretation of balance performance and support clinical decision-making (Benítez-Andrades et al., 2025; García-Liñeira et al., 2023). Patti et al. (2018) used a pressure platform (FreeMed baropodometric platform) in combination with the Romberg Test. Domènech-Vadillo et al. (2019) employed the Nintendo® Wii Balance Board™ (WBB) and RombergLab to analyse the confidence ellipse and overall balance score. In 2019, Karch et al. (2019) developed a functional balance database for military aviators using the Sensory Organization Test with the NeuroCom SMART EquiTest system. Later, Leirós-Rodríguez et al. (2020) conducted an observational study using accelerometery to establish reference values for static balance in single-leg stance.
Given that childhood is a critical period for growth, development, and early identification of disorders, numerous studies have focused on balance in younger populations (Lara et al., 2017). Methods range from computerized posturology, as in the study by Libardoni et al. (2018), to pressure platforms and video recordings of the mBESS test, as used by Howell and Meehan (2016). Some studies, such as that by Román et al. (2017), have assessed balance without relying on biomechanical tools.
The choice of balance assessment method should be guided by the specific objectives and desired outcomes. Measurement duration is a critical factor, it must be long enough to yield reliable results, yet short enough to avoid inducing fatigue. The most used postural conditions for assessment include bipodal, monopodal, and tandem stances (Ricotti, 2011).
For static balance evaluation, the Romberg test has traditionally been used (Ricotti, 2011). However, it has faced criticism due to its limited sensitivity and objectivity (Guskiewicz & Perrin, 1996), leading to the development of the Modified Romberg Test (Clarke et al., 2019). While the standard duration is typically 30 seconds (Kamieniarz et al., 2018; Sebastia-Amat et al., 2020), this can be adjusted based on the individual's age, skill level, and balance status (Siegrist et al., 2016), with variations including 10 seconds (Guralnik et al., 1995; Ricotti, 2011; Siegrist et al., 2016), 15 seconds (Riemann et al., 2017), 20 seconds (Nusseck & Spahn, 2020), or even 1 minute (Clarke et al., 2019).
Other widely used tests for balance assessment include the Balance Error Scoring System (BESS), introduced by Riemann et al. (1999) to evaluate static balance on both stable and unstable surfaces, and the Star Excursion Balance Test (SEBT), which is commonly used to assess dynamic balance (Gribble & Hertel, 2003).
This study proposes a cross-sectional observational design involving participants aged 18–30 years to establish preliminary reference data on balance using the Zebris FDM-S pressure platform and to explore factors associated with balance performance. The Modified Romberg Test will be employed under both bipodal and single-leg conditions, with eyes open and closed. Subsequently, the influence of variables such as sex, lower-limb dominance, and knee alignment will be analysed.
2. Materials and methods
2.1. Study design
A cross-sectional pilot observational study was designed to establish preliminary reference data for balance in healthy young adults and to analyse factors associated with balance performance.
2.2. Ethical considerations
The study complies with the Declaration of Helsinki and is part of the Research Framework Project of the San Juan de Dios School of Nursing and Physical Therapy at Comillas Pontifical University, approved by the Research Ethics Committee of Hospital Clínico San Carlos in 2015 (C.P.–C.I.15/416-E). Prior to data collection, participants received all relevant information and provided written informed consent, in accordance with data protection regulations.
Measurements were carried out at the Biomechanics Laboratory of the Comillas Pontifical University (Ciempozuelos, Madrid), which is covered by civil liability insurance and holds the necessary licenses issued by the Community of Madrid. The individual depicted in Figure 1 provided written informed consent for publication of the figure.
2.3. Participants
A total of 28 healthy participants (12 women and 16 men), aged between 18 and 30 years, took part in the pilot study. Participants were recruited both from within and outside the San Juan de Dios School of Nursing and Physical Therapy (Ciempozuelos, Madrid).
The final sample was selected using non-probability consecutive convenience sampling. Given the exploratory nature of this preliminary study, no a priori sample size calculation was performed. After data collection, a post hoc sample size estimation was conducted using the results of the present study to inform the design of future adequately powered investigations. Using the GRANMO calculator, a two-sided analysis was performed with an alpha level of 0.05, a beta level of 0.20, and a precision of 10% of the mean, as described by Anumula et al. (2014). The required sample size was calculated for each variable, and the highest estimate was selected. Based on these parameters, a sample of 446 participants would be required for a future confirmatory study to detect a difference of at least 3.9 units, assuming a standard deviation of 27.08 and an anticipated dropout rate of 15%.
Exclusion criteria included: pregnancy; musculoskeletal surgery within the past year; history of stroke; inability to understand study instructions (Domènech-Vadillo et al., 2019; Patti et al., 2018); hearing loss (Melo et al., 2017); fever; severe respiratory conditions; pain or musculoskeletal complaints on the day of assessment (Libardoni et al., 2018); balance-related disorders (e.g., vestibular syndromes, neurological conditions, multiple sclerosis); uncorrected visual impairments; systemic diseases; and fractures occurring within six months prior to participation (Domènech-Vadillo et al., 2019; Patti et al., 2018).
2.4. Instrumentation
For this study, all variables provided by the Zebris FDM-S® pressure platform (Zebris Medical GmbH, Isny, Germany) were analysed. These included ellipse parameters (height, width, and area) and weight distribution percentages (anterior and posterior) across different support conditions (bipodal, right and left-side single-leg) and visual states (eyes open and closed). The platform was connected to WinFDM software for the analysis of CG movement. The measurement device was recalibrated before each participant's assessment to ensure accuracy.
To analyse knee alignment using the Q angle (QA) (Maupas et al., 2002), classified as valgus, varus, or neutral, the Kinematic Lab Gonio app (Version 1.1.2) by Ignacio López Moranchel and Patricia Maruelos (2018©) was used. The anterior superior iliac spines (ASIS), the centre of the patella, and the tibial tuberosity were first marked with the patient in the supine position (Merchant et al., 2020). The camera was then aligned with the knee, and a photograph was taken while the patient stood barefoot in an upright position. A line was drawn connecting the three anatomical landmarks to calculate the QA, and the result was subtracted from 180° to obtain the complementary angle (Figure 1).
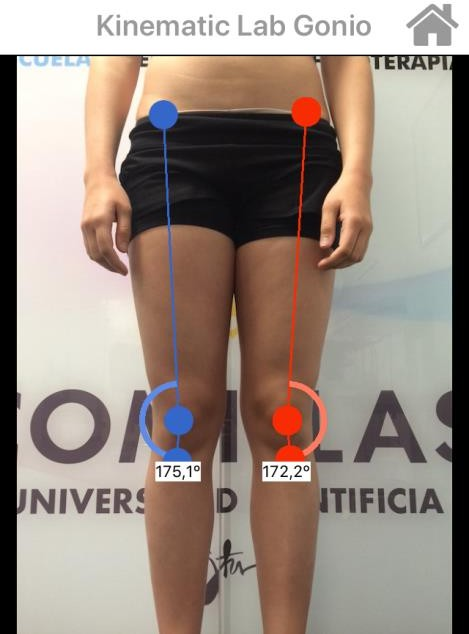
Once values were obtained for each leg, the mean of both was calculated. Based on this average, participants were classified into three groups (Kulli et al., 2019): physiological valgus or normal QA (10–14°) = 0; knee varus or low QA (< 10°) = 1; and knee valgus or high QA (> 14°) = 2.
Lower-limb dominance was determined using a dominance test consisting of three tasks: kicking a ball toward a goal, writing one's name on the floor with the foot, and guiding a ball 10 meters using only one leg (Maupas et al., 2002).
2.5. Procedure
Participants stood barefoot on the pressure platform, and a total of six measurements were taken under different balance conditions, with a one-minute rest period between trials. The rest period was standardised for all participants and measurements, regardless of the participants' performance capacity or fatigue levels. If unnecessary movements unrelated to balance control occurred, the test was repeated, maintaining the rest interval (Plandowska et al., 2019). During each trial, participants were instructed to keep their support in contact with the platform and to remain as still as possible.
- Measurement 1: Bipodal stance, eyes open; feet shoulder-width apart in a relaxed, comfortable position with arms resting by the sides (Nusseck & Spahn, 2020). Gaze fixed on a previously marked point on the wall (Yamagata et al., 2018). Duration: 10 seconds (Guralnik et al., 1995; Kamieniarz et al., 2018; Siegrist et al., 2016).
- Measurement 2: Bipodal stance, eyes closed; same posture and 10-second duration as Measurement 1. Participants step onto the platform with both feet, then close their eyes.
- Measurement 3: Single-leg stance on the lower right limb, eyes open; duration: 15 seconds (Riemann et al., 2017). Procedure: step onto the platform with both feet, then lift the left leg. Movements of the elevated leg and arms are permitted, provided they do not shift body support or touch the platform with the lifted limb (King & Wang, 2017).
- Measurement 4: Single-leg stance on the left lower limb, eyes open; identical protocol to Measurement 3.
- Measurement 5: Single-leg stance on the right lower limb, eyes closed; duration: 15 seconds (Riemann et al., 2017). Participants step onto the platform, lift the opposite leg, then close their eyes. Movement restrictions are the same as Measurement 3.
- Measurement 6: Single-leg stance on the left lower limb, eyes closed; same procedure as Measurement 5.
Balance assessment was based on the following parameters, considering that higher scores indicate greater sway and poorer postural stability:
- Centre of Pressure (CoP) surface parameters: ellipse height (mm), ellipse width (mm), and ellipse area (mm²) (the area traced by the CoP that encompasses 95% of the measurement points, allowing assessment of the magnitude of CoP movement over the support surface).
- Anterior and posterior weight distribution percentages: measured globally during bipodal stance as the average of both feet, and individually for each foot during single-leg stance.
2.6. Data collection, analysis, and statistics
Data were analysed using IBM SPSS Statistics® version 26. For the single-leg stance on the right lower limb with eyes closed, data from three participants were excluded (n = 25). For the single-leg stance on the left lower limb with eyes closed, data from four participants were marked as missing (n = 24). In all cases, exclusion was due to the participants' inability to complete the test correctly after multiple attempts.
To establish preliminary reference values, a descriptive analysis was performed based on the variables sex, dominance, and knee alignment, in relation to ellipse parameters (height, width, and area) and anterior/posterior weight distribution percentages across all balance conditions (bipodal, single-leg, eyes open and closed). This analysis included the mean, median, standard deviation, range, and number of cases.
For inferential analysis examining associations between dependent and independent variables, data normality was assessed using the Shapiro–Wilk test. The results indicated that several variables did not follow a normal distribution. Therefore, nonparametric statistical tests were used, as appropriate, for each inferential analysis.
The statistical significance threshold was set at p < 0.05 for all tests. Statistical correlations between variables were calculated using ellipse height, width, and area, and the anterior and posterior weight distribution percentages across all balance conditions.
For sex (n = 25), differences between male and female participants were analysed using the Mann–Whitney U test. Effect sizes were calculated using the r statistic (r = Z/√N), with values of 0.10, 0.30, and 0.50 interpreted as small, medium, and large effects, respectively. For limb dominance variable, balance performance of the dominant and nondominant limbs during single-leg stance with the eyes open and closed was compared using the Wilcoxon signed-rank-test.
For knee alignment (varus, valgus, or neutral), differences among groups were analysed using the Kruskal–Wallis test. Effect sizes were estimated using epsilon squared (ε²), with values of 0.01, 0.08, and 0.26 interpreted as small, medium, and large effects, respectively. When significant differences were detected, post hoc pairwise comparisons were conducted with a Bonferroni adjustment.
3. Results
A total of 28 healthy young adults (12 women and 16 men) were included in the study. Participants had a mean age of 23.4 ± 3.1 years. According to BMI categories, one participant was classified as underweight (3.6%), 18 as having normal weight (64.3%), five as overweight (17.9%), and four as obese (14.3%).
3.1. Descriptive and inferential statistical analysis by sex
Preliminary reference data on balance, stratified by sex (n = 28), across the different support and visual conditions are presented in Table 1. Owing to occasional missing data, the number of observations varied slightly across variables.
Table 1. Descriptive and inferential analysis by sex
| Condition | Variable | Sex | n | Mean | SD | Median | Range | p-value | Effect size (r) |
|---|---|---|---|---|---|---|---|---|---|
| Bipodal eyes open | Ellipse width | Male | 16 | 3.63 | 2.07 | 2.85 | 7.40 | 0.745 | 0.061 |
| Female | 12 | 3.80 | 2.41 | 3.00 | 9.10 | ||||
| Ellipse height | Male | 16 | 7.43 | 2.53 | 7.10 | 9.80 | 0.889 | 0.026 | |
| Female | 12 | 8.80 | 6.14 | 7.25 | 22.00 | ||||
| Ellipse area | Male | 16 | 23.55 | 19.10 | 16.50 | 71.10 | 0.908 | 0.022 | |
| Female | 12 | 35.50 | 58.19 | 14.85 | 207.70 | ||||
| Anterior weight (%) | Male | 16 | 47.61 | 8.16 | 46.93 | 28.30 | 0.642 | 0.088 | |
| Female | 12 | 46.53 | 7.05 | 44.40 | 23.50 | ||||
| Posterior weight (%) | Male | 16 | 52.39 | 8.16 | 53.08 | 28.30 | 0.642 | 0.088 | |
| Female | 12 | 53.47 | 7.05 | 55.60 | 23.50 | ||||
| Bipodal eyes closed | Ellipse width | Male | 16 | 4.76 | 1.94 | 4.30 | 6.60 | 0.676 | 0.079 |
| Female | 12 | 4.55 | 2.20 | 4.60 | 7.90 | ||||
| Ellipse height | Male | 16 | 9.80 | 3.45 | 9.25 | 11.90 | 0.853 | 0.035 | |
| Female | 12 | 9.88 | 2.90 | 9.95 | 9.70 | ||||
| Ellipse area | Male | 16 | 39.38 | 25.00 | 32.15 | 75.20 | 0.763 | 0.057 | |
| Female | 12 | 38.64 | 30.79 | 35.05 | 112.70 | ||||
| Anterior weight (%) | Male | 16 | 46.75 | 9.01 | 46.10 | 35.00 | 0.430 | 0.149 | |
| Female | 12 | 44.40 | 7.46 | 43.28 | 20.65 | ||||
| Posterior weight (%) | Male | 16 | 53.25 | 9.02 | 53.90 | 35.05 | 0.430 | 0.149 | |
| Female | 12 | 55.60 | 7.46 | 56.73 | 20.65 | ||||
| Single-leg right eyes open | Ellipse width | Male | 16 | 11.96 | 3.60 | 11.15 | 12.30 | 0.095 | 0.316 |
| Female | 12 | 9.63 | 2.13 | 9.35 | 6.80 | ||||
| Ellipse height | Male | 16 | 18.90 | 6.10 | 17.85 | 23.70 | 0.035* | 0.398 | |
| Female | 12 | 14.30 | 2.90 | 14.45 | 8.00 | ||||
| Ellipse area | Male | 16 | 190.43 | 106.71 | 144.70 | 344.30 | 0.016* | 0.455 | |
| Female | 12 | 110.66 | 40.29 | 103.60 | 116.40 | ||||
| Anterior weight (%) | Male | 16 | 51.95 | 6.24 | 51.03 | 21.50 | 0.676 | 0.079 | |
| Female | 12 | 52.68 | 8.55 | 54.35 | 31.50 | ||||
| Posterior weight (%) | Male | 16 | 48.05 | 6.24 | 48.98 | 21.50 | 0.676 | 0.079 | |
| Female | 12 | 47.32 | 8.55 | 45.65 | 31.50 | ||||
| Single-leg left eyes open | Ellipse width | Male | 16 | 11.69 | 2.20 | 11.05 | 6.90 | 0.010* | 0.487 |
| Female | 12 | 9.48 | 1.69 | 8.75 | 5.70 | ||||
| Ellipse height | Male | 16 | 18.08 | 5.24 | 18.60 | 19.00 | 0.353 | 0.176 | |
| Female | 12 | 16.24 | 3.60 | 15.70 | 11.40 | ||||
| Ellipse area | Male | 16 | 170.28 | 66.54 | 176.40 | 210.90 | 0.070 | 0.342 | |
| Female | 12 | 123.68 | 45.21 | 111.60 | 136.70 | ||||
| Anterior weight (%) | Male | 16 | 51.56 | 6.80 | 52.55 | 26.15 | 0.981 | 0.005 | |
| Female | 12 | 51.92 | 6.24 | 51.00 | 20.01 | ||||
| Posterior weight (%) | Male | 16 | 48.44 | 6.80 | 47.48 | 26.15 | 0.981 | 0.005 | |
| Female | 12 | 48.08 | 6.25 | 49.00 | 20.05 | ||||
| Single-leg right eyes closed | Ellipse width | Male | 15 | 21.96 | 4.45 | 21.10 | 17.10 | 0.134 | 0.300 |
| Female | 10 | 19.88 | 5.93 | 18.10 | 18.50 | ||||
| Ellipse height | Male | 15 | 31.77 | 7.52 | 29.40 | 29.10 | 0.114 | 0.316 | |
| Female | 10 | 27.20 | 6.33 | 25.55 | 17.30 | ||||
| Ellipse area | Male | 15 | 558.09 | 235.85 | 476.90 | 957.30 | 0.052 | 0.389 | |
| Female | 10 | 440.08 | 214.60 | 368.80 | 650.70 | ||||
| Anterior weight (%) | Male | 15 | 51.89 | 4.66 | 52.70 | 17.35 | 0.781 | 0.056 | |
| Female | 10 | 51.99 | 6.51 | 52.68 | 18.90 | ||||
| Posterior weight (%) | Male | 15 | 48.11 | 4.66 | 47.30 | 17.35 | 0.781 | 0.056 | |
| Female | 10 | 48.01 | 6.52 | 47.33 | 18.90 | ||||
| Single-leg left eyes closed | Ellipse width | Male | 14 | 20.49 | 5.04 | 21.35 | 18.60 | 0.930 | 0.018 |
| Female | 10 | 20.83 | 3.33 | 20.50 | 12.30 | ||||
| Ellipse height | Male | 14 | 31.72 | 15.27 | 29.45 | 62.50 | 0.334 | 0.020 | |
| Female | 10 | 33.23 | 8.45 | 32.70 | 26.90 | ||||
| Ellipse area | Male | 14 | 551.49 | 371.95 | 496.30 | 1509.30 | 0.639 | 0.096 | |
| Female | 10 | 546.16 | 174.66 | 514.85 | 491.50 | ||||
| Anterior weight (%) | Male | 14 | 54.85 | 7.42 | 54.80 | 26.65 | 0.198 | 0.263 | |
| Female | 10 | 49.49 | 9.31 | 49.60 | 32.55 | ||||
| Posterior weight (%) | Male | 14 | 45.15 | 7.42 | 45.20 | 26.65 | 0.198 | 0.263 | |
| Female | 10 | 50.52 | 9.31 | 50.40 | 32.55 |
Note. Sample sizes (n) may vary across variables because of missing data. Asterisks (*) mark p-values below 0.05.
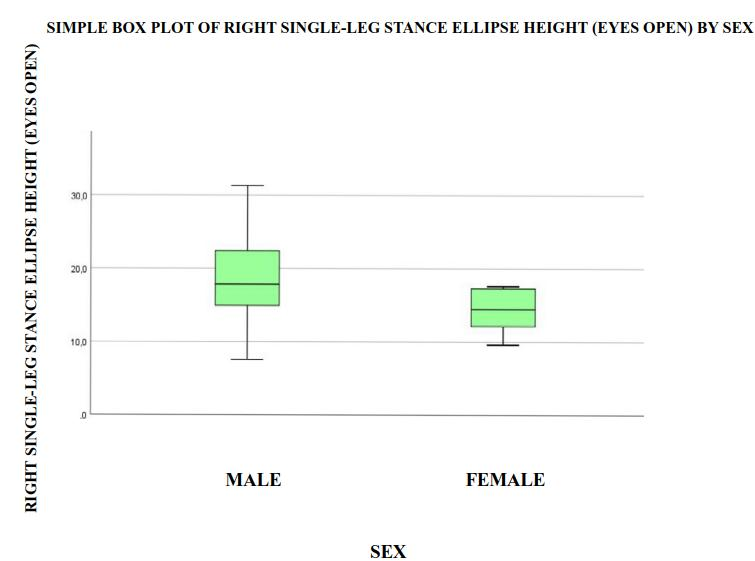
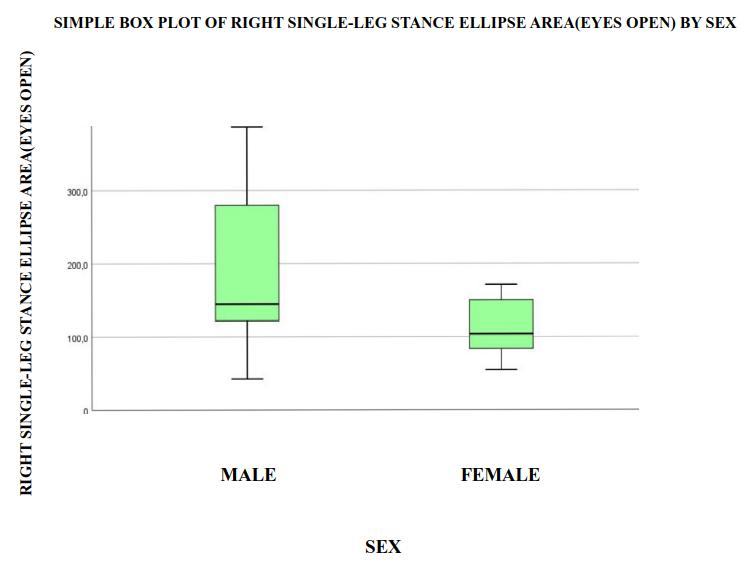
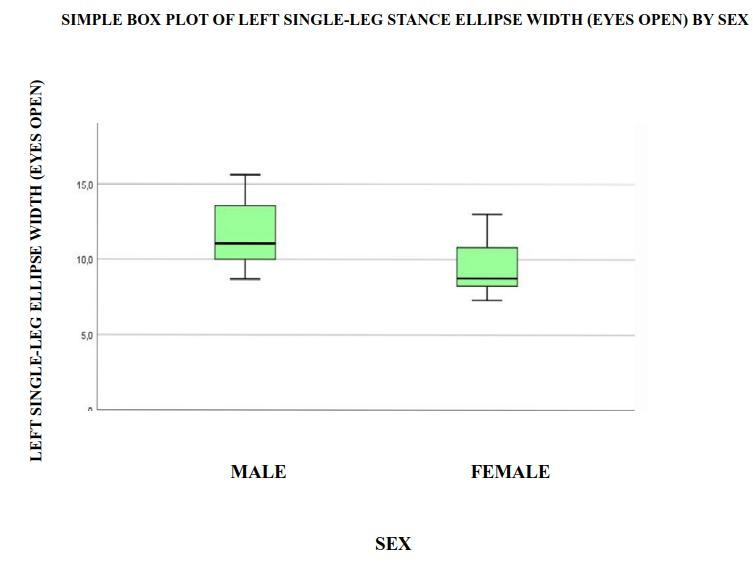
Inferential analysis by sex using the Mann–Whitney U test revealed statistically significant differences (p < 0.05) in ellipse height during right single-leg stance with eyes open (p = 0.035; r = 0.40), ellipse area during right single-leg stance with eyes open (p = 0.016; r = 0.46), and ellipse width during left single-leg stance with eyes open (p = 0.010; r = 0.49) (see Table 1 and Figures 2, 3, and 4). According to conventional criteria, these effect sizes ranged from medium to large, suggesting that the observed differences may have practical relevance despite the relatively small sample size. Overall, these findings indicate sex-related differences in single-leg balance performance under eyes-open conditions, with women exhibiting smaller ellipse dimensions, which may reflect greater postural stability during these specific tasks.
3.2. Descriptive and inferential statistical analysis by dominant versus non-dominant limb
For the descriptive analysis of limb dominance, only participants with right-limb dominance (n = 27) were included. Preliminary reference values by dominance are presented in Table 2. Inferential analysis compared balance performance between the dominant (right) and non-dominant (left) limbs during single-leg stance with both eyes open and closed, using the Wilcoxon test (Table 2). No statistically significant differences between the dominant and nondominant limbs were observed for any of the balance variables (all p < 0.05). These findings suggest that limb dominance was not significantly associated with balance performance under the conditions evaluated.
Table 2. Descriptive and inferential analysis by limb dominance
| Condition | Variable | n | Mean | SD | Median | Range | p-value |
|---|---|---|---|---|---|---|---|
| Single-leg eyes open | Ellipse width (right) | 27 | 10.99 | 3.29 | 10.80 | 12.30 | 0.665 |
| Ellipse width (left) | 27 | 10.82 | 2.27 | 10.70 | 8.30 | ||
| Ellipse height (right) | 27 | 17.06 | 5.48 | 16.30 | 23.70 | 0.838 | |
| Ellipse height (left) | 27 | 17.57 | 4.47 | 17.40 | 18.40 | ||
| Ellipse area (right) | 27 | 158.16 | 93.96 | 126.00 | 344.30 | 0.923 | |
| Ellipse area (left) | 27 | 153.33 | 61.04 | 148.90 | 208.40 | ||
| Anterior weight (%) (right) | 27 | 52.12 | 7.28 | 51.25 | 31.50 | 0.683 | |
| Anterior weight (%) (left) | 27 | 51.59 | 6.54 | 51.55 | 26.15 | ||
| Posterior weight (%) (right) | 27 | 47.88 | 7.28 | 48.75 | 31.50 | 0.665 | |
| Posterior weight (%) (left) | 27 | 48.41 | 6.54 | 48.45 | 26.15 | ||
| Single-leg eyes closed | Ellipse width (right) | 24 | 21.12 | 5.19 | 20.60 | 19.20 | 0.891 |
| Ellipse width (left) | 23 | 20.59 | 4.42 | 21.10 | 18.60 | ||
| Ellipse height (right) | 24 | 30.17 | 7.36 | 29.05 | 33.40 | 0.465 | |
| Ellipse height (left) | 23 | 32.43 | 12.94 | 30.30 | 62.50 | ||
| Ellipse area (right) | 24 | 515.12 | 234.62 | 465.85 | 1075.20 | 0.831 | |
| Ellipse area (left) | 23 | 550.61 | 306.91 | 492.20 | 1509.30 | ||
| Anterior weight (%) (right) | 24 | 51.72 | 5.36 | 51.90 | 20.90 | 0.523 | |
| Anterior weight (%) (left) | 23 | 52.37 | 8.62 | 51.75 | 42.55 | ||
| Posterior weight (%) (right) | 24 | 48.28 | 5.36 | 48.10 | 20.90 | 0.523 | |
| Posterior weight (%) (left) | 23 | 47.63 | 8.62 | 48.25 | 42.55 |
Note. Sample sizes (n) may vary across variables because of missing data.
3.3. Descriptive and inferential statistical analysis by knee alignment
For the variable knee alignment (varus, valgus, or neutral), descriptive analysis was performed using the full sample (9 with neutral alignment, 13 with varus, and 6 with valgus), as presented in Table 3.
Table 3. Descriptive and inferential analysis based on knee alignment
| Condition | Variable | Knee alignment | n | Mean | SD | Median | Range | p-value | ε² |
|---|---|---|---|---|---|---|---|---|---|
| Bipodal eyes open | Ellipse width | Neutral | 9 | 3.21 | 1.43 | 2.90 | 3.90 | 0.873 | 0.000 |
| Varus | 13 | 3.79 | 2.20 | 3.60 | 7.30 | ||||
| Valgus | 6 | 4.28 | 3.16 | 2.85 | 8.00 | ||||
| Ellipse height | Neutral | 9 | 7.70 | 2.81 | 7.00 | 8.30 | 0.738 | 0.000 | |
| Varus | 13 | 6.90 | 2.13 | 7.00 | 7.90 | ||||
| Valgus | 6 | 10.93 | 8.21 | 8.25 | 22.00 | ||||
| Ellipse area | Neutral | 9 | 20.47 | 14.07 | 14.20 | 34.40 | 0.817 | 0.000 | |
| Varus | 13 | 23.19 | 20.11 | 14.80 | 71.10 | ||||
| Valgus | 6 | 52.87 | 80.94 | 16.85 | 207.70 | ||||
| Anterior weight (%) | Neutral | 9 | 45.37 | 5.49 | 44.60 | 15.90 | 0.238 | 0.035 | |
| Varus | 13 | 49.77 | 8.82 | 52.10 | 28.30 | ||||
| Valgus | 6 | 44.15 | 6.45 | 44.13 | 19.70 | ||||
| Posterior weight (%) | Neutral | 9 | 54.63 | 5.49 | 55.40 | 15.90 | 0.238 | 0.035 | |
| Varus | 13 | 50.24 | 8.82 | 47.90 | 28.30 | ||||
| Valgus | 6 | 55.85 | 6.45 | 55.88 | 19.70 | ||||
| Bipodal eyes closed | Ellipse width | Neutral | 9 | 4.71 | 2.45 | 4.10 | 7.90 | 0.974 | 0.000 |
| Varus | 13 | 4.71 | 2.13 | 4.50 | 6.60 | ||||
| Valgus | 6 | 4.52 | 1.24 | 4.65 | 3.60 | ||||
| Ellipse height | Neutral | 9 | 9.88 | 2.65 | 9.60 | 9.50 | 0.503 | 0.000 | |
| Varus | 13 | 9.37 | 3.76 | 9.10 | 11.90 | ||||
| Valgus | 6 | 10.78 | 2.71 | 10.95 | 6.70 | ||||
| Ellipse area | Neutral | 9 | 39.70 | 33.54 | 32.00 | 110.80 | 0.686 | 0.000 | |
| Varus | 13 | 38.45 | 28.06 | 27.10 | 75.20 | ||||
| Valgus | 6 | 39.42 | 16.44 | 40.00 | 51.30 | ||||
| Anterior weight (%) | Neutral | 9 | 43.61 | 5.05 | 41.05 | 15.60 | 0.008* | 0.306 | |
| Varus | 13 | 50.27 | 8.08 | 50.30 | 31.60 | ||||
| Valgus | 6 | 39.15 | 7.93 | 37.25 | 23.00 | ||||
| Posterior weight (%) | Neutral | 9 | 56.39 | 5.05 | 58.95 | 15.60 | 0.008* | 0.306 | |
| Varus | 13 | 49.73 | 8.09 | 49.70 | 31.65 | ||||
| Valgus | 6 | 60.85 | 7.93 | 62.75 | 23.00 | ||||
| Single-leg right eyes open | Ellipse width | Neutral | 9 | 10.20 | 2.24 | 10.10 | 6.40 | 0.426 | 0.000 |
| Varus | 13 | 12.00 | 4.11 | 11.40 | 12.30 | ||||
| Valgus | 6 | 9.83 | 1.50 | 9.80 | 4.10 | ||||
| Ellipse height | Neutral | 9 | 14.06 | 2.45 | 14.70 | 7.60 | 0.060 | 0.145 | |
| Varus | 13 | 19.57 | 6.76 | 20.60 | 23.70 | ||||
| Valgus | 6 | 15.48 | 2.09 | 15.75 | 5.10 | ||||
| Ellipse area | Neutral | 9 | 114.02 | 35.64 | 105.40 | 116.40 | 0.069 | 0.134 | |
| Varus | 13 | 201.65 | 117.86 | 172.20 | 344.30 | ||||
| Valgus | 6 | 121.18 | 32.31 | 115.45 | 84.50 | ||||
| Anterior weight (%) | Neutral | 9 | 52.53 | 4.25 | 54.00 | 12.20 | 0.669 | 0.000 | |
| Varus | 13 | 53.40 | 8.05 | 51.25 | 25.35 | ||||
| Valgus | 6 | 49.41 | 8.99 | 50.23 | 24.06 | ||||
| Posterior weight (%) | Neutral | 9 | 47.47 | 4.25 | 46.00 | 12.20 | 0.669 | 0.000 | |
| Varus | 13 | 46.60 | 8.05 | 48.75 | 25.35 | ||||
| Valgus | 6 | 50.58 | 9.00 | 49.78 | 24.10 | ||||
| Single-leg left eyes open | Ellipse width | Neutral | 9 | 10.13 | 2.26 | 8.90 | 6.30 | 0.473 | 0.000 |
| Varus | 13 | 11.31 | 2.48 | 10.70 | 8.30 | ||||
| Valgus | 6 | 10.45 | 1.72 | 10.80 | 4.70 | ||||
| Ellipse height | Neutral | 9 | 17.98 | 6.02 | 16.70 | 19.00 | 0.651 | 0.000 | |
| Varus | 13 | 17.56 | 3.68 | 17.80 | 10.30 | ||||
| Valgus | 6 | 15.68 | 4.60 | 15.60 | 10.40 | ||||
| Ellipse area | Neutral | 9 | 149.38 | 75.21 | 112.30 | 191.30 | 0.644 | 0.000 | |
| Varus | 13 | 159.06 | 57.93 | 158.70 | 200.50 | ||||
| Valgus | 6 | 132.73 | 55.49 | 134.45 | 138.30 | ||||
| Anterior weight (%) | Neutral | 9 | 53.33 | 3.32 | 55.00 | 9.55 | 0.314 | 0.013 | |
| Varus | 13 | 51.96 | 8.04 | 51.55 | 26.15 | ||||
| Valgus | 6 | 48.75 | 6.06 | 47.80 | 18.40 | ||||
| Posterior weight (%) | Neutral | 9 | 46.67 | 3.32 | 45.00 | 9.55 | 0.314 | 0.013 | |
| Varus | 13 | 48.08 | 8.04 | 48.45 | 26.15 | ||||
| Valgus | 6 | 51.25 | 6.06 | 52.20 | 18.40 | ||||
| Single-leg right eyes closed | Ellipse width | Neutral | 8 | 20.80 | 5.43 | 20.65 | 15.50 | 0.365 | 0.001 |
| Varus | 12 | 22.36 | 5.52 | 21.25 | 19.20 | ||||
| Valgus | 5 | 18.70 | 2.76 | 18.20 | 7.30 | ||||
| Ellipse height | Neutral | 8 | 28.40 | 6.11 | 28.95 | 16.70 | 0.347 | 0.005 | |
| Varus | 12 | 32.04 | 8.34 | 29.60 | 31.00 | ||||
| Valgus | 5 | 27.36 | 6.05 | 26.40 | 15.50 | ||||
| Ellipse area | Neutral | 8 | 477.15 | 196.78 | 443.05 | 521.60 | 0.339 | 0.007 | |
| Varus | 12 | 578.59 | 276.77 | 474.90 | 972.60 | ||||
| Valgus | 5 | 402.36 | 100.14 | 409.00 | 280.50 | ||||
| Anterior weight (%) | Neutral | 8 | 53.01 | 3.45 | 52.98 | 9.70 | 0.259 | 0.032 | |
| Varus | 12 | 52.80 | 5.05 | 54.13 | 16.05 | ||||
| Valgus | 5 | 48.09 | 7.59 | 44.80 | 18.90 | ||||
| Posterior weight (%) | Neutral | 8 | 46.99 | 3.45 | 47.03 | 9.70 | 0.259 | 0.032 | |
| Varus | 12 | 47.19 | 5.05 | 45.88 | 16.05 | ||||
| Valgus | 5 | 51.91 | 7.59 | 55.20 | 18.90 | ||||
| Single-leg left eyes closed | Ellipse width | Neutral | 8 | 21.50 | 2.23 | 21.60 | 5.70 | 0.739 | 0.000 |
| Varus | 12 | 19.94 | 5.28 | 19.90 | 18.60 | ||||
| Valgus | 4 | 20.95 | 5.04 | 21.25 | 12.30 | ||||
| Ellipse height | Neutral | 8 | 34.13 | 8.35 | 34.10 | 25.60 | 0.270 | 0.029 | |
| Varus | 12 | 30.33 | 15.83 | 27.95 | 62.50 | ||||
| Valgus | 4 | 34.85 | 10.72 | 32.70 | 25.20 | ||||
| Ellipse area | Neutral | 8 | 584.01 | 191.30 | 540.50 | 575.90 | 0.381 | 0.000 | |
| Varus | 12 | 519.12 | 388.72 | 425.65 | 1509.30 | ||||
| Valgus | 4 | 570.23 | 210.26 | 524.50 | 437.50 | ||||
| Anterior weight (%) | Neutral | 8 | 53.81 | 4.87 | 53.58 | 12.40 | 0.796 | 0.000 | |
| Varus | 12 | 52.29 | 10.71 | 51.15 | 42.55 | ||||
| Valgus | 4 | 51.19 | 8.50 | 50.05 | 20.15 | ||||
| Posterior weight (%) | Neutral | 8 | 46.19 | 4.87 | 46.43 | 12.40 | 0.796 | 0.000 | |
| Varus | 12 | 47.71 | 10.71 | 48.85 | 42.55 | ||||
| Valgus | 4 | 48.81 | 8.50 | 49.95 | 20.15 |
Pairwise comparison of knee alignment*
| Variable pair | Sample 1 – Sample 2 | Test statistic | Std. error | Std. test statistic | p-value |
|---|---|---|---|---|---|
| Anterior weight (%) – Posterior weight (%) | Neutral | 5.78 | 4.34 | 1.33 | 0.183 |
| Varus | 12.15 | 4.06 | 2.99 | 0.003* | |
| Valgus | -6.38 | 3.57 | -1.79 | 0.074 | |
| Posterior weight (%) – Anterior weight (%) | Neutral | 6.38 | 3.57 | 1.79 | 0.074 |
| Varus | -12.15 | 4.06 | -2.99 | 0.003* | |
| Valgus | -5.78 | 4.34 | -1.33 | 0.183 |
Note. *Each row tests the null hypothesis that the distributions of Sample 1 and Sample 2 are equal. Asymptotic significances (two-tailed tests) are displayed. The significance level is .05.
For the inferential analysis, the Kruskal–Wallis test was used to evaluate whether balance outcomes differed according to knee alignment under each condition. The results (Table 3) revealed significant differences (Figures 5 and 6) in anterior weight distribution during bipodal stance with the eyes closed (p = 0.008; ε² = 0.31) and posterior weight distribution during bipodal stance with the eyes closed (p = 0.008; ε² = 0.31). These large effect sizes suggest that knee alignment may be associated with differences in anteroposterior weight distribution in the absence of visual input.
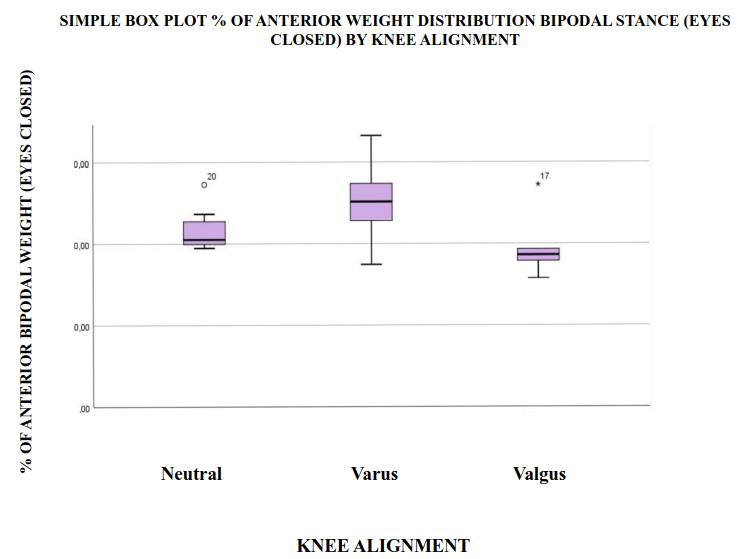
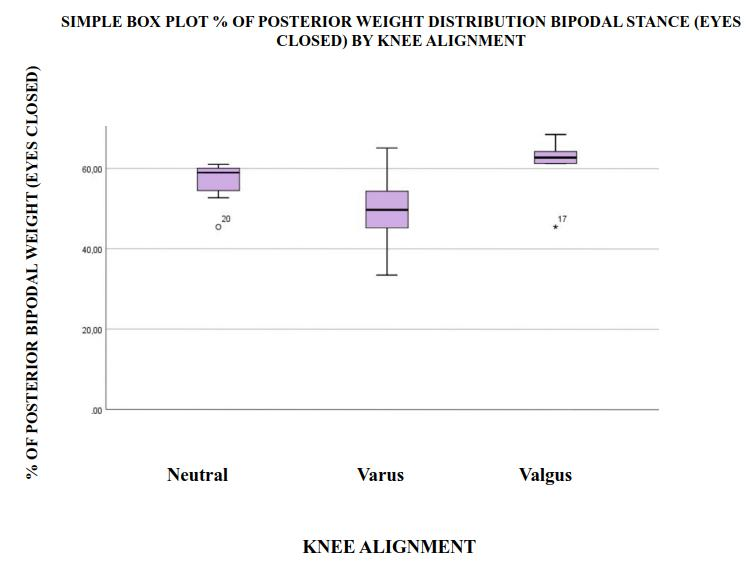
To determine between which groups these differences occurred, pairwise comparisons were conducted using the Bonferroni correction. Significant differences were found for both variables between the varus and valgus knee alignment groups, in both cases with a significance level of p = 0.003.
These results suggest that there are differences in the anterior-posterior weight distribution during bipodal stance with eyes closed, depending on knee alignment, with a more anterior distribution in subjects with varus and a more posterior distribution in subjects with valgus.
4. Discussion
The main objective of the study was to obtain preliminary reference data on balance in healthy young adults aged 18 to 30 years. It is noted that balance impairments are indicative of various neurological, vestibular, and musculoskeletal pathologies. Therefore, the development of accurate assessment tools and the establishment of reference values are crucial for the early detection of these conditions, allowing for timely prevention and intervention in balance-related issues when necessary.
In addition to facilitating the early recognition of pathologies, preliminary reference data on balance allows for the evaluation of the evolution and condition of patients following an injury. This helps establish treatment protocols based on objective information, providing more personalised care and, consequently, a higher quality of recovery.
To date, there are few studies providing preliminary reference data on balance using pressure platforms for the age range analysed. Patti et al. (2018) obtained normative data for bipodal stance with eyes open using the Romberg test in a large sample that includes subjects within this age range. Although some variables, such as height (Y axis), width (X axis), and ellipse area, are comparable, the results cannot be directly contrasted due to differences in measurement protocols and positions.
A similar situation occurs with the study by Domènech-Vadillo et al. (2019), in which bipodal stance with eyes open and closed was measured on a firm surface, selecting the confidence ellipse area (CEA) and the global equilibrium score (GES) as reference values. However, the tool used (WBB) lacks reliability validation, which prevents drawing definitive conclusions and making reliable comparisons.
In the case of Karch et al. (2019) and Leirós-Rodríguez et al. (2020), neither the study population nor the measurement system align with those used in the present research. In the former, reference data were obtained from military-trained aviators using computerised posturography, while in the latter, reference data were only obtained from women aged between 50 and 80 years using accelerometery.
To gain more insight into the factors influencing balance, an analysis was conducted on the variables of sex, dominance, and knee position using the data provided by the pressure platform in each balance condition.
Significant differences were found according to sex in the ellipse height and area during single-leg stance on the right lower limb, and in the ellipse width during single-leg stance on the left lower limb with eyes open. Men showed greater dispersion, whereas women exhibited lower variability and median values for all three measures, suggesting greater postural stability in these specific balance conditions rather than superior balance performance overall. These sex-related differences are consistent with the findings of Howell and Meehan (2016), which concluded that women have better postural control than men during each posture in the mBESS Test. Additionally, Lee and Lin (2007) also noted that girls exhibit better postural control than boys during single-leg stance tasks.
Although balance tests and participant ages vary between studies, the findings of the present study suggest a possible pattern of sex-related differences in specific balance tasks among young adults. It would be interesting to conduct further research analysing these situations in individuals of the same age to confirm the findings, and in older individuals to determine whether sex-related differences persist.
Regarding dominance, greater difficulties were observed when performing the test with the non-dominant limb, requiring more attempts and rest periods to complete it; however, these differences did not reach statistical significance. Therefore, lower-limb dominance was not significantly associated with balance performance under the conditions evaluated in this study. The results are quite surprising, as there is evidence of differences in electromyography activity (Valderrabano et al., 2007) and strength between the dominant and non-dominant limbs; however, this does not appear to affect balance (Jacobs et al., 2005). Nevertheless, the results align with those obtained by Schorderet et al. (2021) in their literature review on the subject, which suggests that balance is a much more complex skill than we imagine, involving both sensory and motor components, where the context and the movement to be performed influence and modify the interaction of the systems involved in balance. Recent evidence has further emphasised the multidimensional nature of balance, highlighting that postural control emerges from interactions among biomechanical, sensory, and neuromuscular factors. This complexity may help explain why variables such as lower-limb dominance are not consistently associated with balance performance across different testing conditions (Benítez-Andrades et al., 2025).
For knee position, statistically significant differences were found in anterior weight distribution (p = 0.008) and posterior weight distribution (p = 0.008) during bipodal stance with eyes closed. Significant differences appeared when comparing varus and valgus positions (p = 0.003). Subjects with varus had a higher percentage of anterior weight distribution, whereas those with valgus had a higher percentage of posterior weight distribution. These findings suggest that knee alignment may be associated with differences in anteroposterior weight distribution under specific balance conditions, consistent with previous evidence linking lower-limb alignment to postural control and injury risk (Letafatkar et al., 2018; Maupas et al., 2002). Furthermore, previous studies have reported that individuals with varus knee alignment may require more time to stabilise and recover their balance following a jump landing than individuals with neutral knee alignment (Letafatkar et al., 2018).
4.1. Limitations
As a structured conceptual review rather than a systematic or scoping review, this study did not employ an exhaustive search, dual independent screening, or formal quality appraisal of This study has some limitations that should be acknowledged. First, the small sample size may have reduced the statistical precision of analyses involving certain subgroups and limited the statistical power to detect subtle differences. Furthermore, given the large number of statistical comparisons performed, the possibility of a Type I error cannot be completely excluded, despite the application of Bonferroni corrections to multiple pairwise comparisons. Therefore, the findings should be considered exploratory and interpreted with caution until confirmed in larger, independent samples. Second, only one trial was conducted under each testing condition, following the protocol used by Domènech-Vadillo et al. (2019). However, previous studies have recommended conducting multiple trials, typically three repetitions, to improve measurement reliability and reduce the potential influence of intrasession variability (Horn et al., 2015). Consequently, the use of a single trial may have limited the robustness of the balance measurements and should be considered when interpreting the findings. In addition, factors such as physical activity level, body mass index (BMI), hindfoot alignment, and psychosocial variables were not assessed, which may have limited the scope of the analysis.
4.2. Future directions
Future studies should include larger samples to improve the robustness and generalisability of reference data on balance and ultimately support the establishment of definitive normative values. This would allow more reliable subgroup analyses and provide a better understanding of the interaction between variables such as sex, limb dominance, and lower-limb alignment. Additional factors that may influence balance, including physical activity level, body mass index, hindfoot position, and psychosocial variables, should also be considered to provide a more comprehensive assessment of postural control. Furthermore, future research should assess balance under more functional and demanding conditions, such as dynamic tasks or sport-specific movements, and integrate additional assessment tools to complement the platform-based measures used in this study.
5. Conclusions
This study provides preliminary reference data on balance in the population examined, which may support the assessment of balance deficits and alterations in postural control among young adults. However, further research involving larger samples is needed to validate and extend these findings.
The results suggest that sex may be associated with differences in balance performance during specific single-leg stance tasks performed with the eyes open, with women exhibiting smaller ellipse dimensions during these tasks. However, these findings should not be generalised to overall balance performance. In addition, no statistically significant differences were observed between the dominant and nondominant limbs under the conditions evaluated.
The findings also suggest that nonneutral knee alignment (varus or valgus) may be associated with differences in anteroposterior weight distribution during bipedal stance with the eyes closed. Specifically, greater forefoot loading was observed among participants with varus alignment, whereas greater rearfoot loading was observed among those with valgus alignment. Given the small sample sizes of the knee-alignment subgroups, these findings should be considered preliminary and confirmed in larger studies.